Species List
Load Packages
library(rebird) # ebird api
library(tidyverse) # fix data
library(sf) # vector map
library(mapview) # maps easy
library(readr) # read table
library(flextable) # make nice table
library(ggplot2)

# Install traitdata from Github
# if(!"remotes" %in% installed.packages()[,"Package"]) install.packages("remotes")
# Install traitdata package from Github
# remotes::install_github("RS-eco/traitdata", build_vignettes = T, force=T)
library(traitdata) # species traits
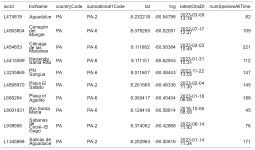
Get species from Hotspots around Parita Bay
We start looking for the hotspot list around Parita Bay
# get hotspots

hotspots <- ebirdhotspotlist(lat = 8.201565, lng = -80.4833, dist = 25) # 25 km around

# for the table
set_flextable_defaults(font.family = "Inconsolata",
                       font.size = 10,  padding = 5,)
ft <- flextable(hotspots)

# make image table
# save_as_image(ft, path = "C:/github/fieldreport_panama/content/posts/2020-12-01-r-rmarkdown/images/hotspots.png")
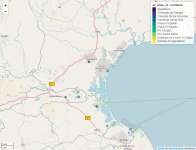
Plot HotSpots
all_sites_sf <- st_as_sf(hotspots, coords= c("lng", "lat"), crs = st_crs(4326))

m <-  mapview(all_sites_sf, zcol = c("locName"), map.types = c( "OpenStreetMap.DE"))

# m

## create standalone .png; temporary .html is removed automatically unless
## 'remove_url = FALSE' is specified
  # mapshot(m, file = "C:/github/fieldreport_panama/content/posts/2020-12-01-r-rmarkdown/images/map.png")
  # browseURL("C:/github/fieldreport_panama/content/posts/2020-12-01-r-rmarkdown/images/map.png")
  # mapshot(m, file = "C:/github/fieldreport_panama/content/posts/2020-12-01-r-rmarkdown/images/map.png",
  #        remove_controls = c("homeButton", "layersControl"))
  # browseURL("C:/github/fieldreport_panama/content/posts/2020-12-01-r-rmarkdown/images/map.png")
Now we get the e-bird taxonomy and compile a single list from all hotspots. After that we make a join with the list of BirdNet species to get the species identifiable using BirdNet.
taxonomy <- ebirdtaxonomy() # get the eBird taxonomy. It is slow....
localSpecies_1 <- ebirdregionspecies(hotspots$locId[1]) # specific hotspot
localSpecies_2 <- ebirdregionspecies(hotspots$locId[2]) # specific hotspot
localSpecies_3 <- ebirdregionspecies(hotspots$locId[3]) # specific hotspot
localSpecies_4 <- ebirdregionspecies(hotspots$locId[4]) # specific hotspot
localSpecies_5 <- ebirdregionspecies(hotspots$locId[5]) # specific hotspot
localSpecies_6 <- ebirdregionspecies(hotspots$locId[6]) # specific hotspot
localSpecies_7 <- ebirdregionspecies(hotspots$locId[7]) # specific hotspot
localSpecies_8 <- ebirdregionspecies(hotspots$locId[8]) # specific hotspot

# Loop to get species per hotspot and taxonomy
sp_by_hotspot <- list()
for(i in 1:length(hotspots)) {
  sp_by_hotspot[[i]] <- inner_join(ebirdregionspecies(hotspots$locId[i]), taxonomy)
}

# make table with uniques
sp_all_hotspot <- sp_by_hotspot %>% bind_rows() %>%
                  select("speciesCode","sciName", "comName") %>%
                  unique()

# read BirdNet species
BirdNet_sp <- read_delim("C:/github/fieldreport_panama/content/posts/2020-12-01-r-rmarkdown/data/BirdNet_sp.csv",
    delim = ";", escape_double = FALSE, trim_ws = TRUE)


# identifiable using BirdNet
identify_sp <- sp_all_hotspot %>% inner_join(BirdNet_sp)
identify_sp$scientificNameStd <- identify_sp$sciName # add common column name

# make html table

ft2 <- flextable(identify_sp)

# make image table
# save_as_image(ft2, path = "C:/github/fieldreport_panama/content/posts/2020-12-01-r-rmarkdown/images/species.png")
Use traits to prioritize species
Get trait list for birds from the elton_birds dataset
# open bird trait
data(elton_birds) # Usar Elton Dieta, estrato forrajeo, habitat primario
elton <- force(elton_birds)

migra <- force(migbehav_birds)
# add traits... Note remove some species by non congruent taxonomy
identify_sp_trait <- elton %>% inner_join(identify_sp)
## Joining with `by = join_by(scientificNameStd)`

########  larger than kilo
larger_sp <- identify_sp_trait[which(identify_sp_trait$BodyMass.Value >= 1000), ] # larger than kilo

########  nocturnal
nocturnal_sp <- identify_sp_trait[which(identify_sp_trait$Nocturnal == 1), ] # larger than kilo

########  Select pelagic
pelagic_sp <- identify_sp_trait[which(identify_sp_trait$PelagicSpecialist==1),]

######## identify migratory sp
identify_migra_sp <- migra %>% inner_join(identify_sp)
## Joining with `by = join_by(scientificNameStd)`
migra_sp <- identify_migra_sp[which(identify_migra_sp$Migratory_status=="directional migratory"), ]
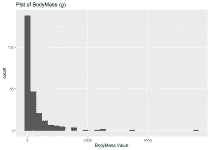
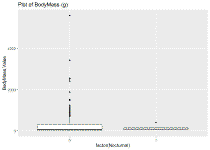
Some trait plots
ggplot(identify_sp_trait, aes(x = BodyMass.Value)) +
  geom_histogram() + ggtitle("Plot of BodyMass (g)")
## `stat_bin()` using `bins = 30`. Pick better value with `binwidth`.
ggplot(identify_sp_trait, aes(x=factor(Nocturnal), y=BodyMass.Value)) + geom_boxplot() + ggtitle("Plot of BodyMass (g)")
Download species lists
Identifable Species
Larger (1 Kilo) Species
Migratory Species
Nocturnal Species
Pelagic Species
- Article published on 2023-01-14
Diego J. Lizcano for Audubon Americas
©2021-2022 Diego J. Lizcano - Powered by hugo and Hugo Split Gallery theme (inspired by Hugo Split Theme and Split Template by One Page Love)


